NASD Prototype Implementation
Implementation
PDL researchers have constructed a second prototype NASD component, running in the OSF/1 kernel of an DEC Alpha workstation, as both a proof of concept and a platform for experimentation with different NASD interfaces, implementations and applications. This prototype supports a native (not layered on the OSF/1 file system) object storage system, cryptographic capabilities, multiple partitions, uninterpreted object attributes and components of the NASD interface that we have defined. By porting both AFS and NFS to this prototype NASD environment, we have been able to experimentally verify estimates of file server off-loading.
We have implemented a working prototype of the NASD drive software running as a kernel module in Digital UNIX. Each NASD prototype drive runs on a DEC Alpha 3000/400 (133 MHz, 64 MB, Digital UNIX 3.2g) with two Seagate ST52160 Medallist disks attached by two 5 MB/s SCSI busses. While this is certainly a bulky “drive”, the performance of this five year old machine is similar to what we predict will be available in drive controllers soon. We use two physical drives managed by a software striping driver to approximate the 10 MB/s rates we expect from more modern drives. Because our prototype code is intended to operate directly in a drive, our NASD object system implements its own internal object access, cache, and disk space management modules and interacts minimally with Digital UNIX. For communications, our prototype uses DCE RPC 1.0.3 over UDP/IP. The implementation of these networking services is quite heavyweight.
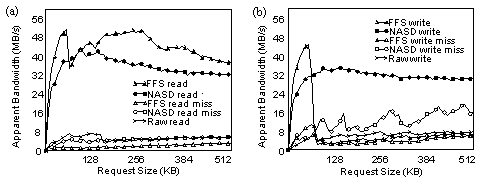
Figure 1 shows the disks’ baseline sequential access bandwidth. This
test measures the latency of each request. Because these drives have
write-behind caching enabled, a write’s actual completion time is not
measured accurately, resulting in a write throughput (~7 MB/s) that
appears to exceed the read throughput (~5 MB/s). To evaluate object
access performance, the prototype was modified to serve NASD requests
from a user-level process on the same machine (without the use of RPC)
and compared that to the performance of the local filesystem. Figure
1 also shows apparent throughput as a function of request size with
NASD and FFS being roughly comparable. The principle differences here
are that NASD is better tuned for disk access (~5 MB/s versus ~2.5 MB/s
on reads that miss in the cache), while FFS is better tuned for cache
accesses (fewer copies give it ~48 MB/s versus ~40 MB/s on reads
that hit in the memory cache).

Figure 1: NASD prototype bandwidth comparing NASD, the local filesystem (FFS) and the raw device during sequential reads (a) and writes (b). The raw device stripes data in 32 KB units over two disks each on a separate 5 MB/s SCSI bus. Response timing is done by a user-level process issuing a single request for the specified amount of data. Raw disk readahead is effective for requests smaller than about 128 KB. In the “miss” cases, not even metadata is cached. For cached accesses, FFS benefits from doing one less data copy than does the NASD code. Both exhibit degradation as the processor’s L2 cache (512 KB) overflows, though NASD’s extra copy makes this more severe. The strange write performance of FFS occurs because it acknowledges immediately writes of up to 64 KB (write-behind), otherwise waiting for disk media to be updated. In this test, NASD has write-behind (fully) enabled as do the disks.
Scalability

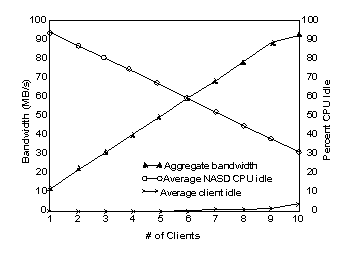
Figure 2: Prototype NASD cache read bandwidth. Read bandwidth obtained by clients accessing a single large cached file striped over 13 NASD drives with a stripe unit of 512 KB. As shown by the client idle values, the limiting factor is the CPU power of the clients within this range.
Figure 2 demonstrates the bandwidth scalability of the NASD prototype
as it meets requests from cache. In this experiment there are 13 NASD
drives, each linked by OC-3 ATM to 10 client machines, (DEC AlphaStation
255s: 233 MHz, 128 MB, Digital UNIX 3.2g). Each client issues a series
of sequential 2 MB read requests striped across four NASDs. From Figure
1, we know that each NASD can deliver 32 MB/s from its cache to the
RPC protocol stack. However, DCE RPC cannot push more than 80 Mb/s through
a 155 Mb/s ATM link before the receiving client saturates.
Computational Requirements
Using our prototype drive software as a baseline, we can estimate the computational power needed in a drive microcontroller to support the basic NASD functions. Code paths of read and write operation measurements are reported in the Total Instructions columns of Table 1. For the one byte requests, our measurements show that the prototype consumes 2.2 cycles per instruction (CPI). There are many reasons why using these numbers to predict drive performance is approximate:
- The prototype uses an Alpha processor (with different CPI properties than an embedded processor);
- Our estimates neglect poorer CPI during copying (which would have hardware assist in a real drive); and
- Our communications implementation is more expensive than we believe to be appropriate in a drive protocol stack.
However, these numbers are still useful for broadly addressing the question of implementing NASD in a drive ASIC. Table 1 shows that a 200 MHz version of our prototype should take 0.4-0.5 msecs for a small request, 70-90% of which is spent in the communications codepath. For 64 KB requests, we estimate 2.5-3.0 msec would be used with 90-97% of the work in communications. For comparison, we examined a Seagate Barracuda drive executing sequential reads. Because this is the most important operation for current drives, a large fraction of each operation is directly handled in hardware. For single sector reads the Barracuda takes only 0.3 msecs and for 64 KB reads it takes only 2.2 msecs.
We conclude that NASD control is not necessarily too expensive but
that workstation-class implementations of communications certainly are.
| Operation | Total Instructions / % Communications | Operation Time (msec) (@ 200 MHz, CPI=2.2) |
||||||||||
| Request Size | 1 B | 8 KB | 64 KB | 512 KB | 1 B | 8 KB | 64 KB | 512 KB | ||||
| read - cold cache | 46k | 70 | 67k | 79 | 247k | 90 | 1488k | 92 | 0.51 | 0.74 | 2.7 | 16.4 |
| read - warm cache | 38k | 92 | 57k | 94 | 224k | 97 | 1410k | 97 | 0.42 | 0..63 | 2.5 | 15.6 |
| write - cold cache | 43k | 73 | 71k | 82 | 269k | 92 | 1947k | 96 | 0.47 | 0.78 | 3.0 | 21.3 |
| write - warm cache | 37k | 92 | 57k | 94 | 253k | 97 | 1871k | 97 | 0.41 | 0.64 | 2.8 | 20.4 |
Table 1: Measured cost and estimated performance of read and write requests. The instruction counts and distribution were obtained by instrumenting our prototype with ATOM and using the Alpha on-chip counters. The values shown are the total number of instructions required to service a particular request size and include all communications (DCE RPC, UDP/IP) and NASD code including kernel work done on their behalf. The measured number of cycles per instruction (CPI) for 1-byte requests was 2.2. The second set of columns use these instruction counts to estimate the duration of each operation on a 200 MHz processor, assuming a CPI of 2.2 for all instructions. For comparison purposes, we experimented with a Seagate Barracuda (ST 34371W). This drive is able to read the next sequential sector from its cache in 0.30 msec and read a random single sector from the media in 9.4 msec. With 64 KB requests, it reads from cache in 2.2 msec and from the media, at a random location, in 11.1 msec. “Write - warm cache” means that the needed metadata is in the cache before the operation starts.