// TRACE: Extended Overview
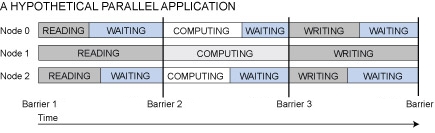
A parallel application’s execution time can be decomposed into I/O time, compute time, and synchronization time. During replay, the challenge is to accurately replay all three, yet realistically scale the replay rate with the speed of the storage system. For example, the figure below illustrates a hypothetical parallel application with multiple phases (read+compute+write):
There are three commonly used replay modes that could be used to approximate the behavior of the above application: timing-accurate, as-fast-as-possible, and a hybrid mode that we call “think limited.”
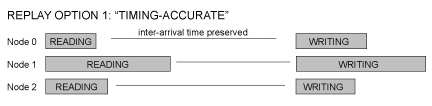
A timing accurate replay issues I/O at the same time that they are issued in the original trace (relative to the beginning of the trace) and therefore assumes that the arrival process (replay rate) of the I/O will not change across storage systems. The figure below illustrates:
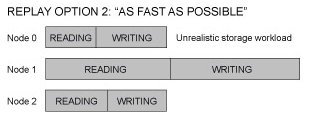
An as-fast-as-possible replay ignores the compute time and synchronization time entirely, and replays the I/O as fast as possible. This mode of replay assumes that I/O is the only significant bottleneck in the system:
Finally, a think-limited replay (a hybrid of timing-accurate and as-fast-as-possible) assumes that the think time between each I/O (compute + synchronization) is fixed across storage systems. As such, it replays the I/O as-fast-as-possible, but also thinks for a fixed amount of time between I/Os.
Unfortunately, none of these approaches is realistic, particularly for applications whose synchronization time is influenced by the speed of the storage system. Ideally, one would want to know the data dependences among the compute nodes, and “replay” such dependences along with the computation and I/O. This is the motivation behind //TRACE.
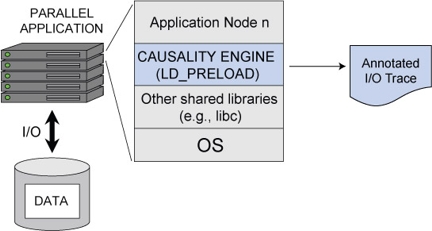
//TRACE is both a tracing engine and a replayer, designed to not require semantic knowledge or instrumentation of the application or its synchronization mechanisms. The causality engine is designed as a library interposer and runs on all nodes in a parallel application. The application does not need to be modified, but must be dynamically linked to the causality engine. Any shared library call issued by the application can be intercepted in this manner. The figure below illustrates:
The objectives of the causality engine are to intercept and trace the I/O calls, calculate the computation time between each I/O, and discover any causal relationships (data dependences) across the nodes. All of this information is stored in a per-node annotated I/O trace log. Then, a replayer (also distributed) can mimic the behavior of the traced application, by replaying the I/O, the computation, and the synchronization.
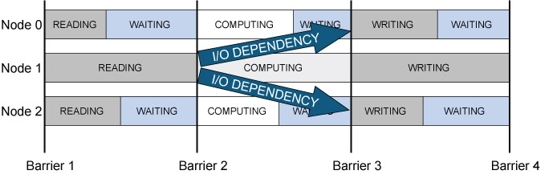
The causality engine discovers data dependencies by delaying the I/O from a given node. For example, by delaying the READ operation of node 1 in our hypothetical parallel application, nodes 0 and 2 will block on the second barrier operation (waiting for node 1 to complete its read). The causality engine can detect that nodes 0 and 2 are blocked, and therefore note their data dependency with node 1. The figure below illustrates:
Of course, to discover all of the data dependencies in this manner, the causality engine must run the application multiple times (once per node) and delay the I/O of each node. However, good replay accuracies can be achieved without delaying every I/O or running the application once per node. Such “sampling” introduces a valuable trade-off between tracing time extraction and replay accuracy.