
Analyzing Failure Data
System reliability is a major challenge in system design. Unreliable systems are not only major source of user frustration, they are also expensive. Avoiding downtime and the cost of actual downtime make up more than 40% of the total cost of ownership for modern IT systems. Unfortunately, with the large component count in today's large-scale systems, failures are quickly becoming the norm rather than the exception.
We believe that the key to building more reliable systems is to first better understand what makes system unreliable, i.e. what do failures in today's large-scale production systems look like. Although system reliability has been a key concern since the first computer systems were build 50 years ago, we know embarrassingly little about basic characteristics of failures in real systems. Much research, in industry as well as academia, is based on hypothetical and often simplistic assumptions, e.g. ``the time between failures is exponentially distributed'' and ``failures are independent''. The reason is that there is virtually no data on failures in real large-scale systems publicly available that could be used to derive more realistic models. The longterm goal of this project is to enable creation of more reliable systems through deeper understanding of real-world failures.
In our recent work, we have collected and analyzed failure data on node outages in a large number of HPC clusters
and data on storage failures in several large production systems.
Our initial analysis shows that many commonly used models and assumptions about failures are not realistic [FAST07, DSN06].
Below we first describe some of our recent results and then outline our longterm research plans
People
FACULTY
POST DOC
Recent Work: Understanding Failures in Storage Systems
As part of this project, we have analyzed field-gathered disk replacement data from a number of large production systems, including high-performance computing sites and internet services sites. About 100,000 disks are covered by this data, some for an entire lifetime of five years. The data include drives with SCSI and FC, as well as SATA interfaces. The mean time to failure (MTTF) of those drives, as specified in their datasheets, ranges from 1,000,000 to 1,500,000 hours, suggesting a nominal annual failure rate of at most 0.88%. Below is a summary of a few of our results.
|
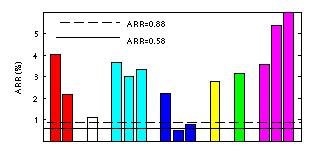
| Figure 1:Comparison of datasheet annual failure rates (solid and dashed line in the graph) and annual replacement rates (ARR) observed in the field for 14 different disk drives populations. |
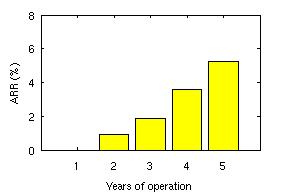 |
| Figure 2: Annual replacement rates observed in the field as a function of drive age. Note that rates in the field are continuously rising with age, while common models suggest steady state during years 2-5 of a drive's nominal lifetime. |
- Large-scale installation field usage appears to differ widely from nominal datasheet MTTF conditions.
The field replacement rates of systems were significantly larger than we expected based on datasheet MTTFs.
For drives less than five years old, field replacement rates were larger
than what the datasheet MTTF suggested by a factor of 2-10.
For five to eight year old drives, field replacement rates were a factor of 30 higher than what the datasheet
MTTF suggested.
Figure 1 above shows the annual replacement rates (ARR) for the 14 different disk populations in our study that included
only disks less than 5 years old.
Nearly all exhibit significantly higher replacement rates that the datasheet MTTFs (solid and dashed line).
- Interestingly, the replacement rates of SATA disks are not worse than the
replacement rates of SCSI or FC disks (unlike commonly assumed). In Figure 1 above
the blue bars and the right-most one of the cyan bars correspond to SATA disk populations, while
all other bars correspond to SCSI or
FC populations. This may indicate that
disk-independent factors, such as operating conditions, usage and
environmental factors, affect replacement rates more than component specific
factors.
- Changes in disk replacement rates during the first five years of the lifecycle were more dramatic than often assumed. While replacement rates are often expected to be in steady state in year 2-5 of operation (bottom of the ``bathtub curve''), we observed a continuous increase in replacement rates, starting as early as in the second year of operation. Figure 2 above shows the increase in replacement rates as a function of drive age for one of the disk drive populations in our study.
- The common concern that MTTFs underrepresent infant mortality has led to the proposal of new standards that incorporate infant mortality. Our findings suggest that the underrepresentation of the early onset of wear-out is a much more serious factor than underrepresentation of infant mortality and recommend to include this in new standards.
Understanding Failures in High-performance Computing Systems
In our recent work [DSN06] we analyze data on node outages in high-performance computing clusters. The data has been collected over the past 9 years at Los Alamos National Laboratory and includes 23000 failures recorded on more than 20 different systems, mostly large clusters of SMP and NUMA nodes. Our findings include for example that average failure rates differ wildly across systems, ranging from 20 to more than 700 failures per year, and that time between failures is modeled well by a Weibull distribution with decreasing hazard rate. From one system to another, mean repair time varies from less than an hour to more than a day, and repair times are well modeled by a lognormal distribution.
|
| Figure 3: The expected decrease in mean time to interrupt (MTTI) in future HPC systems assuming that the number of sockets increases to stay on top500.org. |
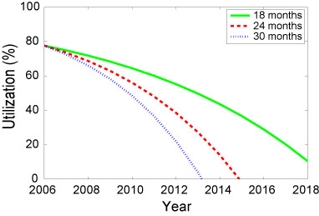 |
| Figure 4: Projections of effective application utilization in future HPC systems under the checkpoint restart model. |
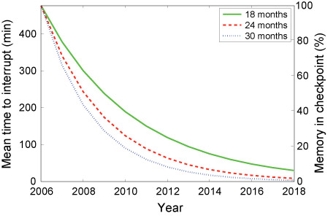
In a related thread of work [SciDAC07, CTWatch], we use the failure data for projections of failure rates of future petascale systems and how they will affect application effectiveness. We predict that if current technology and failure trends continue, the mean time to interrupt (MTTI) can be expected to drop dramatically over the next couple of years (see Figure 3 above). Assuming that fault tolerance is implemented by checkpoint-restart, this means that the largest applications will surrender large fractions of the system's resources to taking checkpoints and restarting from a checkpoint after an interruption, leading to greatly reduced application utilization ( see Figure 4 above). We also discuss coping strategies such as application-level checkpoint compression and system-level process-pairs fault-tolerance for supercomputing.
Statistical Properties of Failure Processes
A significant part of our work focuses on the analysis of the statistical properties of failures, as recorded in our data. Better knowledge about the statistical properties of storage failure processes is not only necessary for a realistic reliability evaluation of new system designs (e.g. when creating synthetic failure workloads in simulations), but may also empower researchers and designers to develop new, more reliable and available systems.
The most common assumption about the statistical characteristics of failures is that they form a Poisson process, which implies two key properties: exponentially distributed time between failures and independence of failures. We find in our analysis for both, disk failures and cluster node outages, that this assumptions is not very realistic. Below we provide some more detail on our results.
|
|
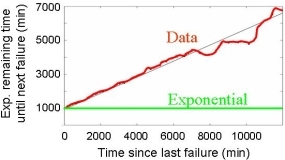
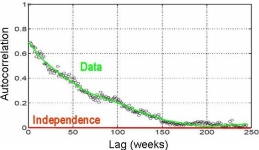
| Figure 5: Illustration of decreasing hazard rates in cluster node failure data. | Figure 6: The autocorrelation of disk failures at different lags. |
- While many have suspected that, for disk failures, the commonly made assumption of exponentially
distributed time between failures/replacements is not realistic, previous studies have not found
enough evidence to prove this assumption wrong with significant statistical
confidence. Based on our data analysis, we are able to reject the
hypothesis of exponentially distributed time between disk replacements with high confidence.
We suggest that researchers and designers use field replacement data, when possible, or
two parameter distributions, such as the Weibull distribution.
- For both disk failures and cluster node outages, we identify as the key features that distinguish the empirical distributions
from the exponential distribution, higher levels of variability and decreasing hazard rates.
Figure 3 illustrates the decreasing hazard rates observed for the time between cluster node outages.
We find that the empirical distributions are fit well by a Weibull distribution with
a shape parameter between 0.7 and 0.8.
- We also find for both, disk replacements and cluster node outages, strong evidence for the existence of various types of correlations. For example, the empirical data exhibits significant levels of autocorrelation and long-range dependence. Figure 4 shows the autocorrelation function for the disk replacement process.
Longterm Research Agenda
Collecting Failure Data
Our plan is to collect detailed failure data from a diverse set of real, large-scale production systems that cover all aspects of system failures: software failures, hardware failures, failures due to operator error, network failures, and failures due to environmental problems (e.g. power outages). At this point, we have established relationships with more than a dozen large commercial sites and high-performance computing (HPC) sites, five of which have already contributed data. We are currently working with the Usenix Association to create a public failure data repository to host these data. A first draft of the repository can be viewed here .While collecting and sharing failure data might seem like a purely mechanical process, it turns out that it involves many research questions by itself. One question is, for example, how to efficiently and reliably sanitize and anonymize Gigabytes of free-form text data, such as trouble tickets. Several of these problems will require techniques from other areas. For example, We plan to investigate the use of methods from text analysis and document retrieval to help automate anonymization and analysis of free-form text data.
Analyzing Failure Data
Our initial results indicate the strong need for new, more realistic failure models. We plan to identify and characterize the most relevant aspects of failure behavior in large IT systems with the goal of deriving accurate failure and repair models for a wide range of systems. Important aspects could, for example, include various statistical properties of the failure process, but also correlations between system parameters, such as workload, and the failure behavior. The results of this work will provide a more realistic basis for both experimental and analytical research on system reliability. While our initial results above are very recent, they are already being used by several researchers to parameterize their experiments and simulations.In our analysis we plan to use not only traditional statistical methods, but also to investigate techniques from data mining, which might be particularly useful in identifying relationships and correlations between various aspects of system behavior and observed failure modes.
A key question will be how complex new failures models need to be. While highly complex models with a large number of parameters will provide a better fit to observed data, they not only pose a risk of overfitting, but will also be harder to use, since they are computationally and intuitively more complex. We are looking for the simplest models that still provide realistic results.
Exploiting Failure Data
Armed with more realistic failure models, a natural next step will be to re-examine existing algorithms and techniques for fault-tolerant systems to understand where simpler (standard) models result in poor design choices and for those cases explore new algorithms. As one example, we revisit the old question of estimating the probability of losing data in a RAID system. We find that the probabilities derived with standard methods (assuming exponential time between failures and independent failures) can be two orders of magnitude lower than estimates derived from real data.
|
|
Figure 5: The probability of a second drive failure in a RAID system during |
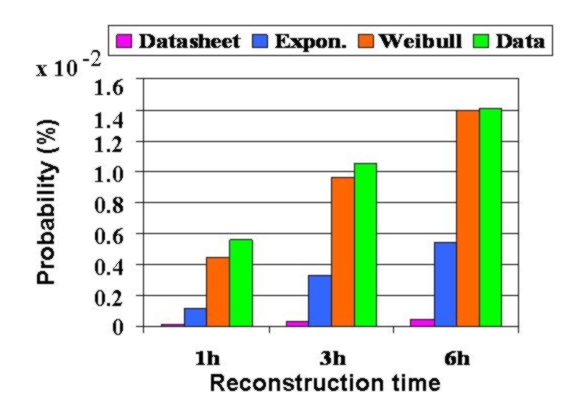
Figure 5 above illustrates this point by plotting the probability that a second drive in a RAID fails during reconstruction, derived in four different ways: the purple bar estimates the probability based on exponential time between failures using the datasheet MTTF; the blue bar estimates the probability based on exponential time between failures, but using the actual empirical MTTF; the orange bar uses a Weibull distribution fit to empirical data; and the green bar shows the estimates directly derived from the data. As the graph shows the estimates derived using the standard approaches (pink and blue bar) can greatly underestimate the probability of a RAID failure.
We also plan to investigate whether we can directly exploit some of the statistical properties of failure behavior. For example, we find that the time between node outages in HPC clusters exhibits decreasing hazard rates and am currently investigating how this property can be used to design more efficient checkpoint protocols. Another general questions is whether we can exploit correlations between past system behavior and future failures for proactive fault management or for automated diagnosis. An interesting avenue for future work would be to investigate the use of data mining and machine learning techniques to solve some of these problems.
Publications
- An Analysis of Data Corruption in the Storage Stack. L. Bairavasundaram, G. Goodson, B. Schroeder, A. Arpaci-Dusseau, R. Arpaci-Dusseau, 6th Usenix Conference on File and Storage Technologies (FAST 2008).
Abstract / PDF [364K]
- Failure Tolerance in Petascale Computers. Garth Gibson, Bianca Schroeder, Joan Digney. CTWatch Quarterly,
vol. 3 no. 4. Volume on Software Enabling Technologies for Petascale Science. November 2007. www.ctwatch.org
PDF [686K]
- Understanding Failures in Petascale Computers. Bianca Schroeder, Garth A. Gibson. SciDAC 2007. Journal of Physics: Conf. Ser. 78.
Abstract / PDF [712K]
- The Computer Failure Data Repository. Bianca Schroeder, Garth Gibson. Invited contribution to the Workshop on Reliability Analysis of System Failure Data (RAF'07) MSR Cambridge, UK, March 2007.
Abstract / PDF [42K]
- Disk Failures in the Real World: What Does an MTTF of 1,000,000 Hours Mean to You? Bianca Schroeder, Garth A. Gibson. Proceedings of the 5th USENIX Conference on File and Storage Technologies (FAST '07), February 13–16, 2007, San Jose, CA. Supercedes Carnegie Mellon University Parallel Data Lab Technical Report CMU-PDL-06-111, September 2006.
Abstract / PDF[ 272K]
Extended version of the above paper appeared in ACM Transactions on Storage (TOS), Volume 3 Issue 3, October 2007, under the title "Understanding disk failure rates: What does an MTTF of 1,000,000 hours mean to you?".
- A Large-scale Study of Failures in High-performance-computing Systems. Bianca Schroeder, Garth Gibson. Proceedings of the International Conference on Dependable Systems and Networks (DSN2006), Philadelphia, PA, USA, June 25-28, 2006. Supercedes Carnegie Mellon University Parallel Data Lab Technical Report CMU-PDL-05-112, December, 2005.
Abstract / PDF [570K]
In the Media
This project has been featured in a number of online media reports:
28 February 2007 - eWeek.com
Hard Disk MTBF: Flap or Farce?
2 March 2007 - Computerworld
Disk drive failures 15 times what vendors say, study says;
Drive vendors declined to be interviewed
2 March 2007 - PC World
Study: Hard Drive Failure Rates Much Higher Than Makers Estimate
Customers replace disk drives 15 times more often than drive vendors estimate, according to a study by Carnegie Mellon University.
20 February 2007 - StorageMojo
Everything You Know About Disks Is Wrong
20 February 2007 - Slashdot
Everything You Know About Disks Is Wrong (slashdot comment thread which received more than 75,000 hits)
Acknowledgements
We would like to thank Gary Grider, Laura Davey and Jamez Nunez from the High Performance Computing Division at Los Alamos National Lab and Katie Vargo, J. Ray Scott and Robin Flaus from the Pittsburgh Supercomputing Center for collecting and providing us with data and helping us to interpret the data. We also thank the other people and organizations, who have provided us with data, but would like to remain unnamed. For discussions relating to the use of high end systems, we would like to thank Mark Seager and Dave Fox of the Lawrence Livermore National Lab.
We thank the members and companies of the PDL Consortium: Amazon, Google, Hitachi Ltd., Honda, Intel Corporation, IBM, Meta, Microsoft Research, Oracle Corporation, Pure Storage, Salesforce, Samsung Semiconductor Inc., Two Sigma, and Western Digital for their interest, insights, feedback, and support.